

 Atlanta Dream
Angel Reese vs. Gabby Williams: How the WNBA's Defensive Player of the Year Race Reached the Finals
Angel Reese won the 2026 award with 46 of 74 votes; Gabby Williams was the runner-up with 20. Starting Saturday at Chase Center, the two best defenders on the ballot meet in a best-of-seven between the league's No. 1 and No. 3 regular-season defenses.
Why we commissioned this. Commissioned because the 2026 Defensive Player of the Year vote placed its winner and runner-up on opposite sides of the Finals, and because the award ranked individuals while the series will test the two team defenses they anchor.
On Oct. 1 the WNBA named Angel Reese its 2026 Defensive Player of the Year, and the vote was not close: 46 of 74 ballots from the league's national media panel, with Gabby Williams second on 20 and nobody else reaching five. Saturday, October 17 at 3:30 p.m. ET, the two of them share a floor in Game 1 of the WNBA Finals, Reese’s Atlanta Dream at Williams’ Golden State Valkyries, at Chase Center.
That is a coincidence of the bracket, not a rivalry. Nothing in the vote says they will guard each other, and the matchup does not require it: Reese is a 6-4 forward who does her work in the paint and on the glass, Williams a 5-11 wing who pressures the perimeter. The vote and the series measure the same thing from opposite ends: the ballot ranked individual defenders; the Finals will test the two team defenses those individuals anchor, and those defenses were built on different methods. One distinction first, because the award announcements arrived a week apart: the league's Most Valuable Player is A'ja Wilson of Las Vegas, with Olivia Miles of Minnesota the runner-up, and neither team is in this series.
How the vote broke
Six players received votes: Angel Reese (46), Gabby Williams (20), A'ja Wilson (4), Shakira Austin (2), Veronica Burton (1) and Rhyne Howard (1). Four of the six, Reese, Williams, Burton and Howard, will be in this series, a point the league's own Finals preview makes.
Reese’s case, in the league's words, rested on volume without precedent. She led the WNBA at 12.1 rebounds per game, ranked third in steals at 1.8, and set single-season records with 521 total rebounds, 206 offensive rebounds and 32 double-doubles. The release ties the rebounding to a team outcome: Atlanta allowed a league-low 9.5 second-chance points per game.
Williams’ case was a perimeter case. The Valkyries' All-Defensive release has her second in the league in defensive net points, tied for fourth in steals per game at 1.6, seventh in steal percentage and tenth in defensive win share, and this month she made the All-Defensive First Team for the second straight season. She was the best defender on the league's best defense; the ballot preferred the player who rewrote the rebounding record book.
What Reese actually does
PropBetEdge's own 2026 record for Reese is 16.4 points, 12.1 rebounds, 2.8 assists, 1.8 steals and 0.7 blocks in 31.0 minutes across 43 regular-season appearances, which matches the complete-season line the league published to the decimal.
Atlanta's All-Defensive announcement adds the on-court framing: the Dream allowed 7.9 fewer points per 100 possessions with Reese on the floor, the largest defensive on/off gap in their rotation, and she led the league in defensive win shares at 3.4. The same release names Rhyne Howard and Jordin Canada alongside her, the first three teammates ever to finish first, second and third in steals per game.
Through five postseason games, all wins, she is at 18.0 points, 8.4 rebounds, 1.6 steals and 2.2 blocks. The rebounding is down from her season rate and the blocks are up threefold; both are five-game samples that say more about the opponents than about her game. The number that has clearly moved is at the line: 27 of 31 free throws, 87.1%, against 72.1% in the regular season.
What Williams actually does
Williams’ 2026 record in our data is 14.4 points, 3.3 rebounds, 2.2 assists, 1.6 steals and 0.2 blocks in 25.1 minutes across 39 appearances, again identical to the league's published line. Put the two season lines side by side and the vote stops looking like a judgment about who is the better defender and starts looking like a judgment about which kind of defense is easiest to count.
Reese produces rebounds and steals at rates the box score cannot miss. Williams’ value shows up in the shots opponents do not get: the Valkyries held opponents to a league-low 47.8% effective field-goal percentage in the regular season, with Williams and Veronica Burton on the perimeter and Kiah Stokes, fourth in the league at 1.7 blocks per game, behind them. All three were named All-Defensive this month, Williams to the First Team, Burton and Stokes to the Second.
Her postseason has been louder than her season: 22.7 points, 4.8 rebounds, 4.0 assists and 1.7 steals in 31.3 minutes through six playoff games, up from 14.4 points in 25.1 minutes during the season. That jump is its own story, told in the companion feature on her playoff run.
Angel Reese and Gabby Williams: 2026 regular season
Per-game lines from PropBetEdge’s season aggregate, which matches the league’s published complete-season statistics
Two different jobs: interior volume on one side, perimeter pressure in fewer minutes on the other.
Regular season only. Playoff lines are quoted in the text with their game counts.
PropBetEdge 2026 season records (completed games) values as of Oct 16, 2026 payload decfe9d23248e300
Show the numbers in this figure
| Angel Reese · 43 games | Gabby Williams · 39 games | |
|---|---|---|
| Points | 16.4 | 14.4 |
| Rebounds | 12.1 | 3.3 |
| Assists | 2.8 | 2.2 |
| Steals | 1.8 | 1.6 |
| Blocks | 0.7 | 0.2 |
| Minutes | 31 | 25.1 |
The defensive ratings, as the league publishes them
Golden State finished the regular season with the WNBA's best defensive rating at 99.1 points allowed per 100 possessions; Atlanta was third at 103.5. In the playoffs the order flipped: Atlanta holds the postseason's best rating at 102.0 and Golden State is second at 104.1. The regular-season figures cover 44 games each; the playoff figures cover five games for Atlanta and six for Golden State, against different opponents, which is why they are context rather than a ranking.
Defensive rating, as published by the league
Points allowed per 100 possessions; lower is better
Regular season: 44 games each. Playoffs: 6 games for Golden State, 5 for Atlanta, through the Semifinals.
Official league figures, cited rather than recomputed. Ranks: Golden State 1st and Atlanta 3rd in the regular season; Atlanta 1st and Golden State 2nd in the playoffs.
WNBA.com: 2026 WNBA Finals Preview: Golden State vs. Atlanta (Brian Martin) values as of Oct 16, 2026 payload 1bacc846fbf40dfd
Show the numbers in this figure
| Regular season · 44 games | Playoffs | |
|---|---|---|
| Golden State Valkyries | 99.1 | 104.1 |
| Atlanta Dream | 103.5 | 102 |
How each defense ends a possession
PropBetEdge's season totals show how the two teams reached similar places by different routes. Golden State allowed 75.1 points per game on 41.4% opponent shooting; Atlanta allowed 84.5 on 46.9%. Read the raw points with the pace attached: by our possession estimate the Dream played 84.1 possessions a game to the Valkyries' 77.4, which is most of the gap in points allowed and exactly why the per-100 rating is the fairer comparison.
Where the methods separate is in what each defense takes. Atlanta averaged 9.1 steals and forced 15.4 turnovers a game in our record, and the league counts 18.1 points off turnovers per game in the regular season, rising to 24.4 in the playoffs. Golden State averaged 7.8 steals and forced 13.7 turnovers but blocked 4.0 shots a game to Atlanta's 3.3. Atlanta, for its part, allowed 6.3 offensive rebounds a game to Golden State's 7.9, the Reese effect in team form. One defense ends possessions by taking the ball; the other by making the shot bad. Neither number predicts the other.
The regular-season series, dated as such
Golden State swept the regular-season series 3-0: 77–66 on June 24 at Golden State, 78–75 on June 26 at Golden State and 88–83 on July 4 at Atlanta. The league notes all three came within 11 days, during a five-game Atlanta losing streak, and that Game 1 will be the teams' first meeting in more than three months.
In those games Williams averaged 19.3 points and 2.0 steals in our record, the figures the league's preview also quotes. Reese averaged 14.0 points and 12.3 rebounds, with nine steals across the three games, six of them in the 78–75 loss. Atlanta scored 66, 75 and 83 points, 74.7 on average against a season figure of 91.3.
Those are June and July numbers. All three games came before the Dream added DeWanna Bonner at the end of August, and Atlanta enters the Finals on what the league calls a franchise-best 10-game winning streak. The series is a record of what happened, not a projection.
Five measurable matchups
First, the offensive glass: Atlanta pulled down 10.6 offensive rebounds a game in our record, led by the player who set the single-season record for them, and Golden State conceded 7.9. Second, the turnover exchange: Atlanta forced 15.4 a game, Golden State committed 10.4, the lower figure of the two by a clear margin, and the league has Atlanta's steals at 10.4 a game in the playoffs.
Third, the close finish: the league's preview has Atlanta 3-0 in clutch games this postseason and Golden State 3-1, after regular-season marks of 9-6 and 9-9; Williams leads all playoff scorers with 25 clutch points on 7-for-18 shooting, and Reese has 14 on 5-for-6 from the field and 4-for-4 from the line. Fourth, the rotations: Atlanta's starters averaged a league-high 31.2 minutes and Golden State's a league-low 24.1, while the Valkyries' bench scored 35.9 points a game to the Dream's 17.9. Fifth, Allisha Gray, Atlanta's leading regular-season scorer at 19.0 points per game, who missed the last two Semifinal games with a left-hand injury and told WSB-TV this week she is day-to-day.
The counterargument
Awards are regular-season verdicts. The vote closed before a playoff possession was played, and the one team-level figure that has moved since, the defensive rating, moved against the order the ballot implied. Five and six games are small samples against different opponents, and the Valkyries' playoff rating came against a Las Vegas offense led by the league's MVP.
PropBetEdge's WinBA Score is not a tiebreaker either. On the frozen September board Reese ranks No. 3 of 193 qualified players at 82.6 and Williams ranks No. 19 at 73.9. WinBA is an association-with-winning index built from box-score production, win rate, production in wins and court share. It does not measure defense, it is not a league award, and most of the gap between the two ratings is a minutes gap: Williams played 25.1 minutes a game to Reese’s 31.0.
What the vote does settle is narrower and still useful. The two best defenders on the 2026 ballot are on opposite sides of a best-of-seven, and the teams they anchor finished first and third in defensive efficiency over 44 games. Games 1 and 2 are at Chase Center; Games 3 and 4 move to State Farm Arena, the first Finals games in Atlanta since 2013. The series will not re-vote the award. It will show which method travels.
Evidence & methodology16 cited records · how this story was built
Records cited
- The WinBA Index — frozen September 2026 board — “The WinBA Index: the WNBA’s top players for September 2026” · observed Sep 20, 11:17 PM ET · source ↗
- PropBetEdge 2026 season aggregate · observed Oct 16, 2:36 PM ET
- PropBetEdge 2026 regular-season aggregate — Angel Reese · observed Oct 16, 2:36 PM ET
- PropBetEdge 2026 regular-season aggregate — Gabby Williams · observed Oct 16, 2:36 PM ET
- PropBetEdge postseason game log — Angel Reese · observed Oct 16, 2:36 PM ET · source ↗
- PropBetEdge postseason game log — Gabby Williams · observed Oct 16, 2:36 PM ET · source ↗
- PropBetEdge 2026 team season totals — Golden State Valkyries · observed Oct 16, 2:36 PM ET · source ↗
- PropBetEdge 2026 team season totals — Atlanta Dream · observed Oct 16, 2:36 PM ET · source ↗
- PropBetEdge WNBA Finals Game 1 record · observed Oct 16, 2:36 PM ET · source ↗
- WNBA (publisher report) · observed Oct 16, 2:03 PM ET · source ↗
- WNBA (publisher report) · observed Oct 16, 2:03 PM ET · source ↗
- Atlanta Dream (dream.wnba.com) (publisher report) · observed Oct 16, 2:03 PM ET · source ↗
- Golden State Valkyries (valkyries.wnba.com) (publisher report) · observed Oct 16, 2:03 PM ET · source ↗
- WNBA (publisher report) · observed Oct 16, 2:03 PM ET · source ↗
- WNBA (publisher report) · observed Oct 16, 2:03 PM ET · source ↗
- NBA Communications (pr.nba.com) (publisher report) · observed Oct 16, 2:03 PM ET · source ↗
How this story was built
The idea for this feature was commissioned by an editor; every number in it was composed deterministically from stored records and cited official pages.
Season lines, team totals, possession estimates and head-to-head game logs are PropBetEdge records built from completed 2026 games. Each figure carries the hash of the frozen record it was read from, and the renderer verifies a chart’s payload before drawing it.
Vote totals, defensive ratings, clutch records, rotation minutes and All-Defensive selections are quoted from the official WNBA and club pages in the evidence list, with the time each was read. PropBetEdge does not compute defensive rating and does not restate those figures as its own.
The playoff window closes at the tip of Game 1 of the Finals. Postseason averages exclude the Finals and will not be revised as the series is played.
WinBA Score is PropBetEdge’s association-with-winning index. It does not measure defense and is not a league award; it appears here only as labelled context.
Photo: ESPNPictured: Angel Reese.
Generated by PropBetEdge’s deterministic newsroom (wnba-commission/1.3.0 · wnba-commission/1.3.0) and checked by the publication gate before release; betting relevance: contextual.
Editorial policy · Corrections & revisions · Methodology · Sources
Related coverage
Newsroom →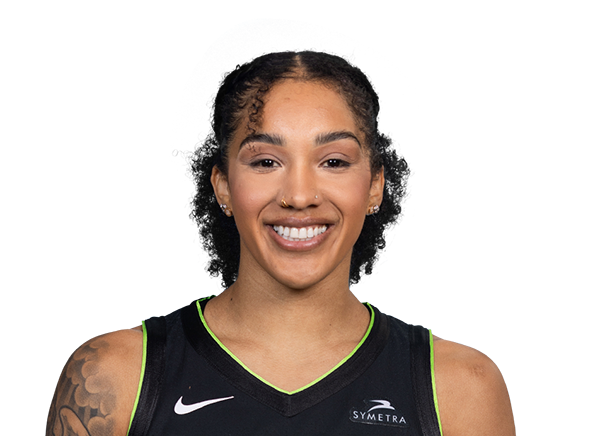
 Golden State Valkyries
Gabby Williams' Playoff Breakout: How Golden State Reached the 2026 WNBA Finals in Year Two
Gabby Williams averaged 14.4 points in the regular season. Through six playoff games she is at 22.7, and the Valkyries, an expansion team in its second year, have won five of them, including a sweep of the defending champions. The numbers behind the rise, and what the Dream will test.

 PBE Newsroom ·
  Atlanta Dream
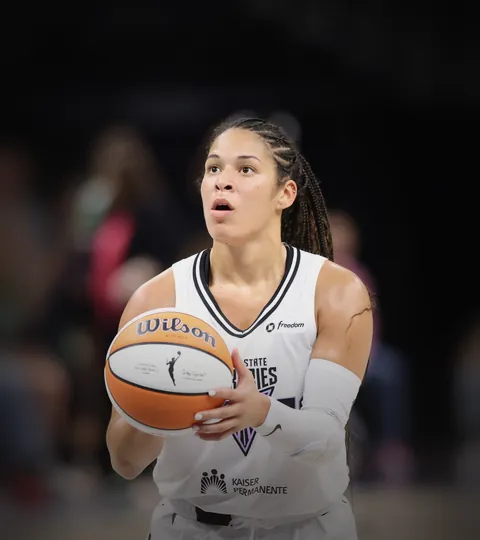
Dream at Valkyries, Game 1: Valkyries favored by 2.5 in a tighter matchup than the spread suggests
The Golden State Valkyries are 2.5-point favorites at home against the Atlanta Dream. one player across the two teams has a provider return estimate on game day, making availability part of the pregame read.
PBE Newsroom · PBE matchup research, PropSports injury feed Golden State Valkyries
The Valkyries beat the Aces 87–77 in Game 3, advance to the WNBA Finals
The Valkyries came back from 11 down to win the semifinals series 3–0; the No. 4 Dream are next.
 PBE Newsroom · PropSports box score + play-by-play + shot locations, PropSports team schedules